Runkeeper and the collection of personal health data
We stand at the edge of a dive into the Internet of Things, where all devices speak the language of data. One of the most interesting applications of this technology is tracking our own bodies to learn what and how we’re doing.
I like working with data; by profession, I’m a data scientist. My interests with data surround how to organize and present its structure, my guilty pleasures are maps and graphs. So when I found out that Runkeeper could map my runs and produce detailed graphs, I couldn’t help but try it out.
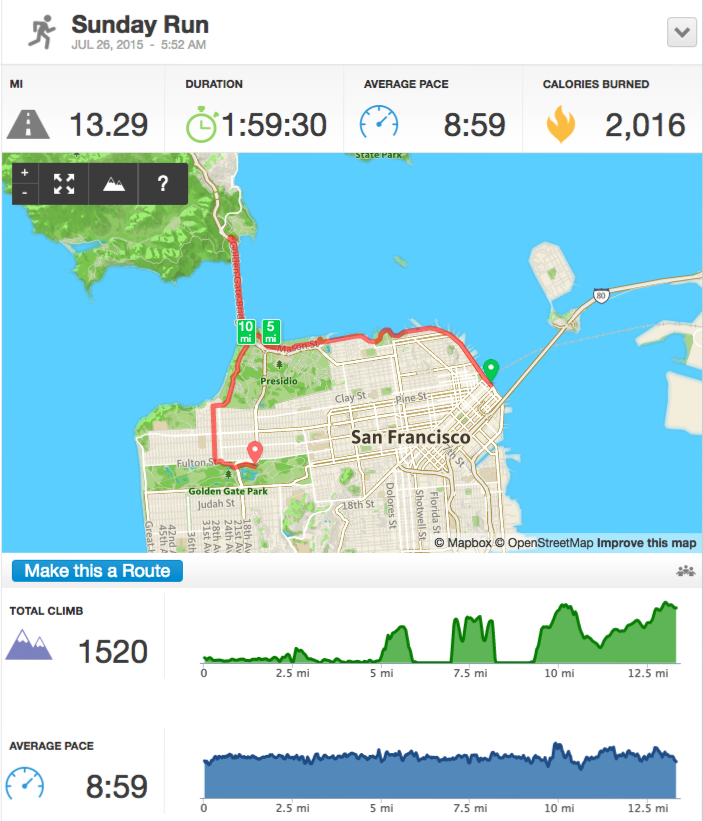
My first half marathon, as organized by Runkeeper.

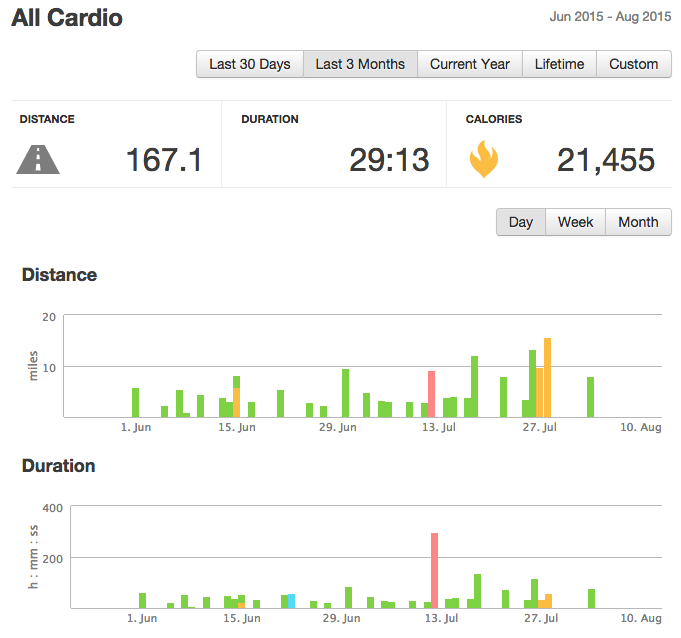
Here’s my training regimen, as organized and presented by Runkeeper. Note that the different colored bars represent different activities: green is running, red is hiking, and yellow is biking.

Having almost real-time data about my runs kept me honest and supported me when I was doubting that work worked. As someone who had never run before, this kind of visualization made the struggle more easily appreciated; it made tangible my efforts.
I think people will like this, and they will like it a lot. The competitive aspect of people pushing their bodies is already starting to be realized (think Running2Win and Flywheel), but the dangers of that kind of attitude carried out without restraint is also clear (CrossFit).
Training with data means easy accessibility to information about your body and its performance. Who isn’t going to want to know about their sleep quality (SleepCycle) or an irregular heartbeat? Google is already developing contact lenses for detecting glucose levels via contact lenses. Once that avenue is developed, we might be able to track all kinds of data about ourselves: vitamin and hormone levels, blood oxygen content, etc. The technology will take a while to develop and will likely remain an early-adopter novelty for many years, but once it becomes more affordably accessible, it will skyrocket in popularity. We should be planning how to organize and present this health data.
In the meanwhile, data junkies like me have more work than we can handle. Fortunately, there are cool tools like Mapbox to help us easily visualize all of this data (yes, Runkeeper permits gpx downloads).